LesvePhotometry user guide
Last update : 2026-01-08
The main window of LesvePhotometry consists of 3 parts
- a menu bar at the top
- tabs in the central frame
- a lower frame
After installation, run the program and fill or correct the input boxes in the central frame tabs:
Quick links
Central frame
Lower frame
File menu
Retrieving information from UCAC4 , ATLAS-(Gaia-PanSTARRS) and APASS DR10 Catalogs
Reports
Reinsch Spline window
Central frame tabs
"General Settings" tab
For each report, uncheck the option if you want to skip the corresponding report generation
The reports provide the observation time in JD, except if "Heliocentric JD" option is checked
CBA Header
Observer (used in the AAVSO report)
An optional note may be added in the AAVSO report
Database : directory containing the default database used for photometry
"Photometry parameters" tab
- Mode
- Mode 1 Normal photometry mode
This mode is using one or an ensemble of comparison stars
For ensemble photometry, more than one Reference star (R) must be used
in the "Usage" column of Variable star window, see hereafter.
Two different methods may be used for "Ensemble Photometry" : Master star, Mean values and Weighted Mean values, see
How LesvePhotometry is performing Ensemble photometry paragraph in the FAQ page
- Mode 2 Photometry with transformation to the Standard System
This mode works as Mode 1 but the data are color transformed for a maximum of five filters
from the list (U, B, V, R, I, SU, SG, SR, SI, SZ) using the Transformation coefficients
given in the right panel of the tab "Transformation parameters" which have to be inputted manually or calculated with Mode 3
The program automatically detects which combination of filter is used in the image sequence.
After data reduction, the program looks for groups of observations, see AAVSO definition of Group of observations
http://www.aavso.org/aavso-extended-file-format
For each group the color indices are calculated. The color indices are tabulated and plotted in the Excel report.
AAVSO and CBA reports will be generated in separate files for the untransformed and transformed data.
- Mode 3 Color transformation calibration
The program will reduce groups of images of a Standard Field (e.g. M67, M11 or NGC7790) for a maximum of five filters
from the list (U, B, V, R, I, SU, SG, SR, SI, SZ) and will calculate the Transformation coefficients.
You are not constrained to use all filters for calibration.
You have to define a maximum of five filters in the "Transform parameters" tab, see next section.
The program automatically detects which combination of filters is used in the image sequence
and calculates the corresponding transformation coefficients.
The calibration process needs the same number of images in each filters.
E.g. if you provide 3 images in V and 3 images in I, the Tv_vi and Tvi coefficients will be calculated.
The transformation coefficients are defined according to the paper of Bruce Gary
CCD Transformation Equations.pdf
The definition of the coefficients is provided here for the case when you use B V R I filters.
If you use other filters the coefficients are defined in the same way by interchanging the letters defining the filters.
Tb_bv = slope of B-b against B-V
Tv_vr = slope of V-v against V-R
Tv_vi = slope of V-v against V-I
Tr_ri = slope of R-r against R-I
Tbv = slope reciprocal of b-v against B-V
Tvr = slope reciprocal of v-r against V-R
Tvi = slope reciprocal of v-i against V-I
Tri = slope reciprocal of r-i against R-I
Note that coefficients provided in VPhot for the AAVSONet telescopes are not defined in the same way.
The coefficient Tv is defined as slope of (V-v) against (B-V). It is easy to convert the AAVSO Tv' to Tb :
Tb = Tv' + 1 - 1/Tbv with Tv' = slope of (V-v) against (B-V) . For demonstration, see the following
AAVSO Photometry discussion (no more available on the AAVSO website)
AAVSONet W28 Transformation coefficients.pdf
The program generates the normal excel report and a TGReport text file.
To analyse the consistency of the transformation coefficients,
you may use the generated TGReport as input for the TransformationGenerator provided by AAVSO.
It is also possible to enter manually your transformation coefficients in the right panel of "Transform parameters" tab.
To get M67 standard field data, you may use the LesvePhotometry tab "AAVSO VSP tool" and introduce HW Cnc
as variable star and check the box "StdField".
Comparison sequences for "Color transformation calibration"
In the Database, you define a comparison sequence for a Standard Field like you do it for a Variable star.
You are limited to 10 Standard Field Comparison stars as for a Variable star.
But it is possible to concatenate multiple comparison sequences and
to perform the calibration on a larger set of comparison stars with different colors (B-V) as explained in the next paragraph.
This improves the reliability of the calibration.
The calculation process to get the Transformation coefficients is done in two steps.
The first step reduces the image and creates a table containing the measured and known magnitudes for each star and each filter.
This table is saved as a csv file named : "Std Field Measurements created current date and time".
In the second step, you are asked if you want to append the current measurements to a previous set of measurements saved on a file.
In this way, you may obtain Transformation coefficients from more than 10 Standard Field stars.
Create two or more comparison sequences (e.g. M67-1, M67-2,..) containing different Standard Field stars.
Run the "Color transformation calibration" on your images with the different comparison sequences.
For the second and other sequences append the current measurements to the previous saved file.
- Aperture radius, Gap and Annulus
The AAVSO recommands to use
for precision, an aperture radius comprised between 1.5 and 2.0 times the FWHM (in pixels)
for high SNR, an aperture radius equals to 0.7 times the FWHM (in pixels)
If you select the checkbox Aperture based on FWHM,
the program will use for the aperture radius the FWM times the factor Aperture radius (in FWHM).
If you don't check this checkbox, the radius value is fixe and is set manually in the text box Radius (in pixels)
Notice the FWHM is measured by doing individual Gaussian PSF fits to the 20 brightest unsaturated stars in the sky image.
- Var Min SNR : the reports will not include data if the SNR of target/variable, Reference and Check stars is lower than this value.
See Which data are considered as valid? in the FAQ page.
- Maximal Flatness : the reports will not include data if the star shape is too elongated
- For check boxes "If Variable is not detected by PinPoint place Variable aperture at sky coordinates"
and "Report Fainter than and low SNR" See respectively
How to cope with very faint Variable stars
and
Reporting Fainter Than value
"Transform parameters" tab
Before launching LesvePhotometry to calculate the Transformation coefficients on a set of images,
you have to define a maximum of 5 Color Bands in the list U, B, V, R, I, SU, SG, SR, SI, SZ and click on "Validate Color Bands" button.
The labels of Filter Band Coefficients and Color Index Coefficients in right panel will be updated accordingly.
It is recommended to enter filters in this order from top to bottom.
Otherwise you will have unconventional coefficients like (V-B) instead of (B-V).
Once the Color Bands are defined, you may run LesvePhotometry in Mode 3 (see section above)
or manually enter your coefficients calculated with another program.
In this tab, you also define the First and Second-order extinction coefficients k' and k" for each filter bandpass.
The FAQ section "First and Second extinction coefficients"
describes those coefficients and links to interesting references about atmospheric extinction.
The atmospheric extinction correction is generally significant only if you observe at low altitude (airmass > 2),
with a large field of view (FOV >1 degree) and/or if you measure stars of extreme color (e.g., B-V>2).
Otherwise, the correction will be a few milli-mag.
However, in the conditions noted previously, the correction may be many hundredths
magnitude (e.g. >0.03 mag). For stars of extreme color, the second order extinction
correction may be larger than the first order extinction correction.
As the first order extinction coefficient varies from night to night, the check box
"Apply 1st and 2d extinctions" is not saved from session to session.
If the values for the k' and k" are not assigned, the corresponding extinction corrections are null.
To apply the second-order extinction coefficient to Variable measurements, you have to assign
a color-index (B-V) to the variable of interest. Note that the second order extinction coefficients are quite stable..
For the comparison stars, the program will read the color-index (B-V) from the database,
if the color-index is not available in the database, the second-order extinction correction will be null.
The second-order extinction coefficients are dependent of the used filter (B,V,..,SG,SR,..)
but the color-index of the star (Variable or comparison) is always given as (B-V) even for Sloan second-order extinction.
It is possible to convert Sloan magnitudes
to UBVRI magnitudes and vice-versa using the appropriate buttons in the "Comparison star window"
"PinPoint parameters" tab
- the star catalogs locations
- see PinPoint documentation for the other parameters
"Default settings" tab
LesvePhotometry is looking for needed parameters in the FITS header of image files.
If parameters are not found, it will use the default parameters only if the corresponding check box has been checked.
It is better to adapt parameters in the program used to control the camera.
BZERO BSCALE physical ADU = BZERO + BSCALE * array_value
PEDESTAL Correction to add for zero-based ADU
EGAIN Electronic gain in e-/ADU
EXPOSURE or EXPTIME exposure time in seconds
XPIXSZ YPIXSZ pixel size in microns
FOCALLEN focal length in milimeters
FILTER filter band, accepted values U B V R I C (C for clear) and SU SG SR SI SZ for Sloan filters
FOCALLEN focal length in milimeters
OBJCTRA sexagesimal right ascension of image (optional)
OBJCTDEC sexagesimal declination of image (optional)
SITELAT or LAT-OBS sexagesimal observatory latitude
SITELONG or LONG-OBS sexagesimal observatory longitude (East longitude are positive)
"Configuration Save/Load" tab
All parameters are stored in ASCOM Profile i.e. they will be re-used when you reopen the program,
except some special parameters identified with a blue label.
Nevertheless you can also save the current configuration in a file. This feature is useful
when you work on images created from different telescopes or cameras.
For each telescope you can use a specific configuration file.
You will be prompted to provide a directory and a file name for the configuration file (.txt).
All parameters and settings in
- General Settings
- Photometry parameters
- PinPoint parameters
- Default settings
will be saved in the configuration file
"AAVSO VSP tool" tab
This tool able you to download and import comparison star sequences as provided by AAVSO.
- In corresponding Variable TableIndex box enter the name which will be used in the LesvePhotometry database
- Enter a Variable star name reconized by AAVSO VSP tool in the corresponding box.
- Fill the Field of View and Maximal magnitude of comparison star boxes.
- If you import a Standard field (e.g. M67), select the "StdField" box.
TIP : To get M67 standard field data, you may use HW Cnc
as variable star.
- Click on "Download VSP sequence" button, the comparison star magnitude will appear in the left panel
and a window with the corresponding chart will open.
- In the left column of the left panel, select appropriate "Usage" value for up to 10 comparison stars.
- Click on "Import VSP sequence in database" button and carefully read and answer the Message boxes.
The sequence will be imported in your database.
Standard field charts
On webpage https://www.aavso.org/apps/vsd/stdfields you find a list of Standard open cluster fields and Landolt fields.
To import those standard fields in LesvePhotometry follow this procedure:
Open https://www.aavso.org/apps/vsd/stdfields page
Choose the desired standard field and click on the link in the second column
A chart will open, click on "Photometry Table for This Chart"
Record the ChartID of the Photometry table, not the one on the chart. Indeed the ChartID given in the chart itself is incorrect for some Standard fields, due to a bug in AAVSO tool.
In LesvePhotometry, open the "AAVSO VSP tool" input ChartID and a name in "LesvePhotometry database VariableTableIndex".
Click "Download VSP sequence" as usual.
Lower frame
"TableIndex of Variables"
This field can be left blank if in the image file name the characters before a delimiter are
the variable database key. The delimiter character ("-", "#" or "%") is user selectable in the "General Settings" tab.
E.g. if image file name is IYUMa#R-001.fit, the program will search the database for a star having the key IYUMa.
With this rule for image file names, you may run LesvePhotometry with a mix of different stars. If you mix different stars,
specific reports will be created for each star.
If you do not follow this rule for image file name, you have to input the database star key.
In the other way around, if you have more than one Variable star in the field of your images, see the special procedure
explained in the document ManyVariablesInField.txt
"Photometry - Go"
Click this button to launch the program, a window will pop-up. Select your sky images for photometry.
"Load 1 image for UCAC4 info"
Click this button to select one sky image for star identification based on UCAC4 catalog.
See chapter : Retrieving UCAC4 Catalog information
File menu
Create a New Empty Database
You will be prompted to provide a directory and a name for your new database.
Maintenance of a Database
- select the database you intend to open for inspection or for maintenance (e.g. VS_Database.db3)
Variable star window
- In Variable Selector window, click on a Variable name and all the fields for this Variable will be displayed.
If you modify an entry click " Save it in database" button.
It is easy to share a part of your Variable star database with other users :
- to export data of the selected Variable star,
click on the "Export this star Group" button. The comparison stars used with the Variable star will be exported at the same time.
You will be prompted to select a text file to export the data.
See an example of the exported file StarExport example.txt
- to import such a transfer file, in "File" drop down menu, select "Import..."
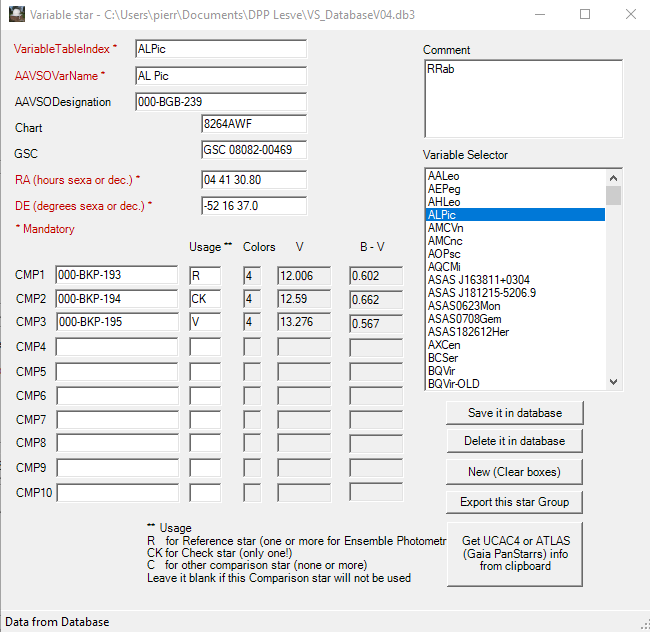
In Variable star window :
VariableTableIndex mandatory, is the table index key, it must be unique in the database.
AAVSOVarName mandatory, is used in the report file names and as the star name in the AAVSO report.
As it is used as a part of report file name it can't use the following characters.
If you use one of those character it will be replaced by a blank in the report file names.
< (less than)
> (greater than)
: (colon)
" (double quote)
/ (forward slash)
\ (backslash)
| (vertical bar or pipe)
? (question mark)
* (asterisk)
AAVSODesignation AUID AAVSO Unique IDentifier, not mandatory
Chart this field is used in AAVSO report, define here which AAVSO chart reference
RA (hour) and DE coordinates of the Variable star
CMPx define here the index of reference / comparison stars
In the "Usage" column:
R indicates that this star will be used as a Reference star for the magnitude calculations.
You can select more than one reference star (Ensemble photometry)
CK this star will be used as the check star, ONLY ONE star as check star.
This star will be used as the check star in the AAVSO report
C this star will be used as another check star but not included in the AAVSO report.
"Usage" field will be left blank, if you don't want to use the corresponding comparison star but nevertheless you want to keep it.
- Double click a comparison star name (CMP1 to 10) and a new window will open with the comparison star data
Comparison star window
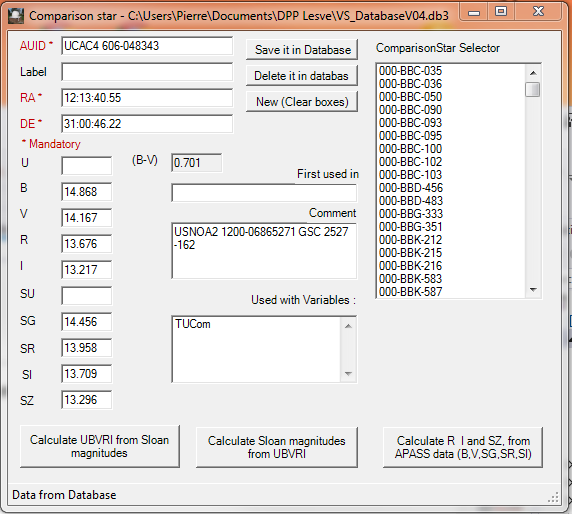
Now you can introduce the comparison star data. To insert a new comparison star, type its name in the CMP field of the Variable and double-click the name.
Filters
Classical Johnson U B V and Cousins R I and Sloan filters u' g' r' i' z' are supported by LesvePhotometry.
The references to Sloan filters are those used by AAVSO : SU SG SR SI SZ for u' g' r' i' z', respectively.
Those references must be used in the image FITS header for the FILTER keyword.
Three buttons are provided to calculate the magnitude from one system to another system.
UBVRI to Sloan magnitudes
The following relationships (Jester et al. 2005 AJ 130, 873
http://arxiv.org/abs/astro-ph/0506022v1)
are used to convert reference magnitudes in UBVRI system to Sloan system.
SG = V + 0.60 * (B-V) - 0.12
SR = V - 0.42 * (B-V) + 0.11
SU = SG + 1.28 * (U-B) + 1.13
SI = SR - 0.91 * (R-I) + 0.20
SZ = SR - 1.72 * (R-I) + 0.41
Sloan to UBVRI magnitudes
The following relationships from the same Jester's article are used to convert reference
magnitudes in Sloan system to UBVRI system.
V = SG - 0.59 * (SG - SR) - 0.01
B = SG + 0.39 * (SG - SR) + 0.21
R = V - 1.09 * (SR - SI) - 0.22
I = R - 1.0 * (SR - SI) - 0.21
U = B + 0.78 * (SU - SG) - 0.88
APASS data
The AAVSO Photometric All-Sky Survey APASS is conducted in five filters : Johnson B and V plus Sloan SG SR SI.
A button "Calcuate R I and SZ from APASS data" is provided to calculate the missing reference magnitude from APASS data.
This button uses the following relationships (Jester et al. 2005 AJ 130, 873):
R = V - 1.09 * (SR - SI) - 0.22
I = R - 1.00 * (SR - SI) - 0.21
sz = R - 1.72 * (R - I) + 0.41
The AAVSO "Seqplot" tool also uses the first two relationships for calculating R and I magnitudes.
The DSLR filters TB, TG, TR are also supported in accordance to AAVSO specifications.
Export - Import
In "Maintenance of a Database" you have an option to export star Groups
(i.e. data of a Variable star and its comparison stars) in a transfer file.
To import such a transfer file, generated by another user or by the the AAVSOtoLesve.exe program written by Steve Rau:
- In "File" drop down menu, select "Import Variable and comparison stars.".
- You will be first prompted to select a database and after to select a transfer file with extension ".txt".
If the Variable star is already in the database, you will be asked if you want
to override the data (Yes) or to skip these data (No) or to abort the importation (Cancel). A example of the content of an exported group is given hereafter.
Each line starts with the token "Variable" or "Comparison" and continues with all the star data.
Variable #AALeo#AA Leo#000-BCW-206#nomad##11 39 14.23#10 19 38.4#GSC 860-754#GSC 860-586#GSC 860-398########R#CK#C########Mag range 11.65 to 12.81
Comparison #GSC 860-754##11 39 07.15#10 16 18.48#10.762#10.329#10.04###Nomad
Comparison #GSC 860-586##11 39 40#10 19 51#11.933#11.334#10.92###Nomad
Comparison #GSC 860-398##11 39 10#10 18 10#13.42#13.14#12.7###Nomad
Retrieving information from UCAC4 , ATLAS (Gaia-PanSTAARS) and APASS DR10 catalogs
The release of PinPoint 6.0 (dc3.com) supports the Fourth U.S. Naval Observatory CCD Astrograph Catalog (UCAC4).
The UCAC4 is a large catalog (over 8GB), covering the 8 to 16 magnitude range.
https://irsa.ipac.caltech.edu/data/UCAC4/ucac4.html.
This catalog is interesting for users as it contains the AAVSO Photometric All-Sky Survey magnitudes
(APASS release DR6 -June 2012) http://www.aavso.org/apass.
The release of PinPoint 7.0 (dc3.com) supports the ATLAS All-Sky Stellar Reference Catalog ("ATLAS-REFCAT2)
ATLAS-REFCAT2 (160GB) which is an all-sky reference catalog containing nearly one billion stars down to apparent magnitude m~19.
The catalog includes PanSTARRS DR1, ATLAS Pathfinder, ATLAS re-flattened APASS, SkyMapper DR1, APASS DR9, Tycho-2, and
the Yale Bright Star Catalog. Gaia DR2 serves as the source of the astrometric solution for ATLAS-REFCAT2.
LesvePhotometry has been tested successfully with PinPoint 6.1 and 7.0 version.
Downloading UCAC4 and ATLAS(Gaia-PanSTAARS) catalogs
The detailed instructions to download the catalogs are given in the following document written by Bob Denny of dc3.com.
Downloading and Using PinPoint Reference Catalogs (Updated Feb 2025).pdf.
The ATLAS catalog is divided in 5 magnitude chunks:
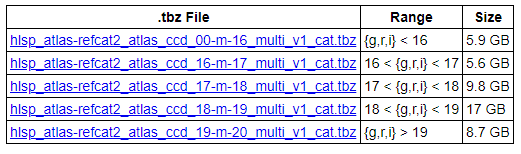
The chunk sizes in GB are the sizes before decompression. LesvePhotometry has been checked with all of them, but you probalbly don't need the last two ones.
Instructions to retrieve data from UCAC4 , ATLAS and APASS DR10 catalogs
- Launch LesvePhotometry and in "PinPoint parameters" tab, enter the paths of the UCAC4 and ATLAS catalog folders
but you do not need to select one of these catalogs to retrieve information from these catalogs.
- Click on the button "Load 1 image for UCAC4-ATLAS-APASS DR10 info" and select a FITS image. The usual sky image window opens.
You may also use the button "Download a DSS image to get UCAC4-ATLAS-APASS DR10" to download images from http://archive.eso.org/dss/dss
- In the sky image window, click on a star and a window displaying "UCAC4-ATLAS-APASS DR10 Catalog Information" will pop-up.
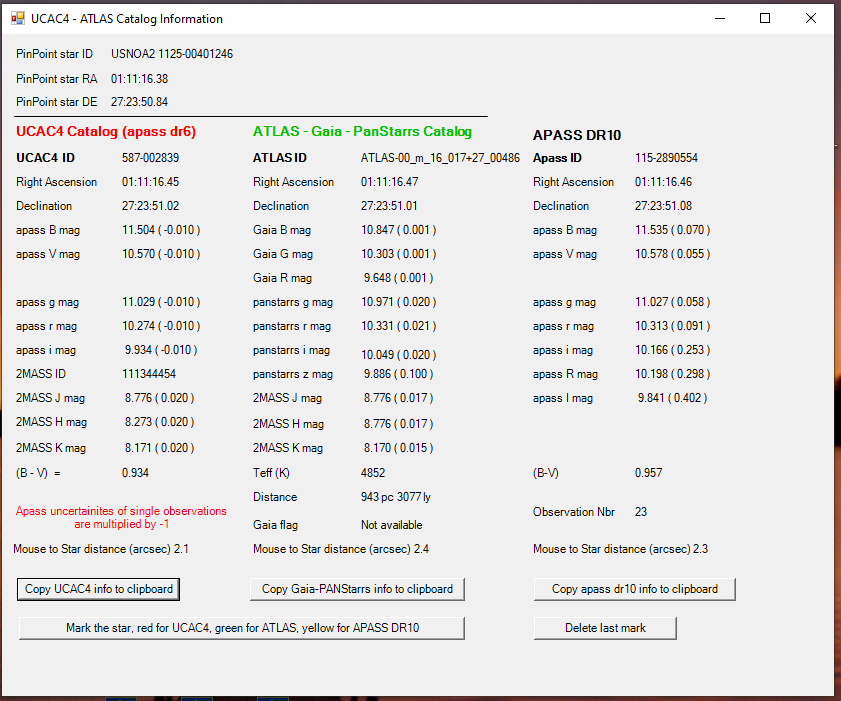
- The first lines refer to the data found by PinPoint, i.e. information from the catalog chosen in "PinPoint parameters" tab.
PinPoint does not match all detected stars to the catalog. In this case the information fields are left blank.
- The other lines are UCAC4 , ATLAS and APASS DR10 star data, i.e. data of the closest star in respect to the position of last mouse click.
The position tolerance is 5 arc seconds.
The ATLAS catalog is divided in folders (one per magnitude chunk e.g. 00_m_16), each folder contains files (one for each coordinate square degree e.g. 017+27)
and each file contains a line per star (e.g. 553). The ATLASID in this example is ATLAS-00_m_16_017+27_00553.
The APASS DR10 information is retreived from the AAVSO website.
- For your convenience you may also mark the selected star with the button "Mark the star ....".
You also may delete the last marks with the button "Delete last mark
Import the data in a comparison star sequence
- Open the "Variable star" window as usual (File - Maintenance of a database - select the database)
- In "UCAC4-ATLAS Catalog Information" window click on "Copy UCAC4 info to clipboard" or on "Copy Gaia-PanStarrs info to clipboard" button or
on "Copy apass dr10 info to clipboard".
- In "Variable star" window, click on "Copy UCAC4 or Gaia PanStarrs or APASS DR10 info from clipboard", you will be prompted for a comparison star number
(n = 1 to 10) corresponding to the CMPn textbox. The data will be automatically copied in the comparison star window.
- Repeat this process for other comparison stars and don't forget to save data in the database.
The ATLAS catalog contains the Gaia GB, GG and GR magnitudes.
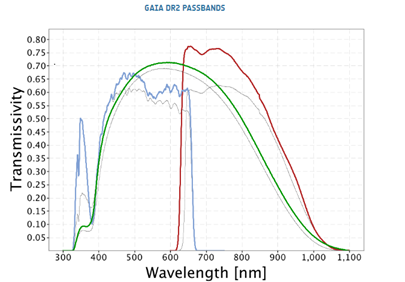 The coloured lines in the figure show the passbands for GG, GB and GR (green: GG; blue: GB; red: GR), defining the Gaia DR2 photometric system.
Gaia DR2 Passbands are given in https://www.cosmos.esa.int/web/gaia/iow_20180316.
To be compared to Johnson-Cousins pass bands
The coloured lines in the figure show the passbands for GG, GB and GR (green: GG; blue: GB; red: GR), defining the Gaia DR2 photometric system.
Gaia DR2 Passbands are given in https://www.cosmos.esa.int/web/gaia/iow_20180316.
To be compared to Johnson-Cousins pass bands 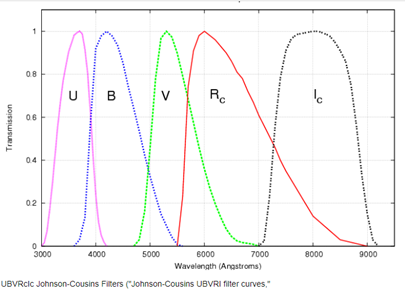 When clicking on "Copy Gaia-PanStarrs info from clipboard" button the Gaia magnitudes are converted to
Johnson-Cousins V, R and I magnitudes using relationships
When clicking on "Copy Gaia-PanStarrs info from clipboard" button the Gaia magnitudes are converted to
Johnson-Cousins V, R and I magnitudes using relationships
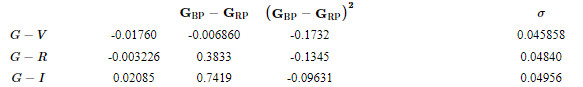 provided in Table 5.8 of the document:
https://gea.esac.esa.int/archive/documentation/GDR2/Data_processing/chap_cu5pho/sec_cu5pho_calibr/ssec_cu5pho_PhotTransf.html.
provided in Table 5.8 of the document:
https://gea.esac.esa.int/archive/documentation/GDR2/Data_processing/chap_cu5pho/sec_cu5pho_calibr/ssec_cu5pho_PhotTransf.html.
Reports
Five reports can be generated
- AAVSO extended report
- CBA report
- Photometry excel report with a chart presenting the light curve.
- Csv report (Comma separated values). Exactly the same as Photometry excel report, but useful if you don't have Microsoft Excel.
- Lew's Plotter excel report. Lew Cook has developed a plotting excel workbook to plot data given in the format of AAVSO extended report.
For your convenience, LesvePhotometry is able to create a copy of the Lew's master excel workbook and directly paste the data inside the excel workbook.
This excel workbook has 14 different plots, e.g. airmass, instrumental magnitude against time but also magnitude errors against airmass or magnitude.
All the Lew's Plotter capabilities and explanations are given at http://www.lewcook.com/lewaavsoformatplot.htm
Many thanks to Lew Cook who wrote this excel workbook and authorized its distribution.
For the five reports, the file names have the following structure:
report_type observation_date star_name ON report_generation_time.extension
The report files are saved in the same directory as the analyzed ccd images.
Reinsch Spline window
Beside the 3 reports, two windows are open for measurement of light curve extrema.
The algorithm used for the smoothing is known as Reinsch spline.
A theoretical document of the algorithm is provided with the program installation.
The Reinsch Spline program (ReinschSpline.exe) can be also used standalone.
The Spline function is used to calculate an extremum (maximum or minimum) of the light curve.
After getting the light curve with ReadClipboard" button, the data points and the spline curve are displayed in
the Plotting Form. At this time you have to click on "left" and "right" buttons to set the left and right limits
used by the algorithm to determine the extremum. The left and right limits must encompass only one extremum.
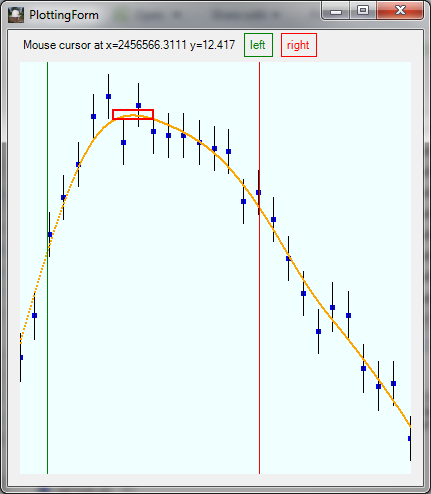
As soon as these limits are set, the extremum parameters are calculated: i.e. ToM and Mag@M. You can save
these results with "Save to Clipboard" and "Save to file" buttons, four numbers are saved, e.g.
12.408 0.007 2456566.3048 0.0022
which are Extremum magnitude value and uncertainty, HJD or JD of Extremum value and uncertainty.
The uncertainties calculations are based on data encompassed by the left and rights limits.
If you enter star coordinates and check the box "Apply Heliocentric corrections" the extremum will be expressed in HJD instead of JD.
With the "Keep only center data" button, the Plotting Form will show only data included between the left and
right limits. This feature is useful if you want to only examine a part of the light curve.
If the Reinsch Spline function is called by the LesvePhotometry program, the star coordinates are also provided
and the "Apply Heliocentric corrections" option is checked by default.